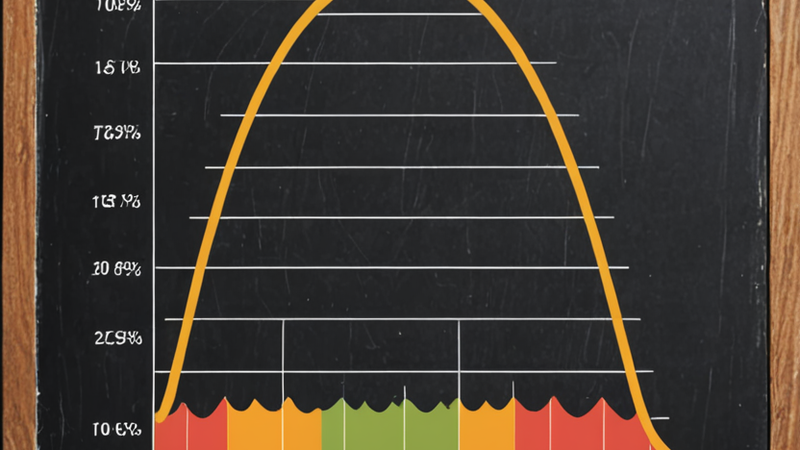
11 PM. The parent group chat drops a screenshot of a pediatric checkup report: “What’s your kid’s height percentile right now? Ours just hit P90.”
You dig out your kid’s report flashing P15, fire up a search for “pediatric short stature which department”, and doomscroll until 1 AM.
Cut the panic. This post will translate that P15 into plain English first—spoiler: it’s almost certainly not what you’re assuming.
Plain English first: a height P15 means if you randomly sample 100 kids of the same age and sex, ~15 will be shorter and ~84 will be taller.
It just maps where your kid sits in the population distribution. That’s it.
P50 (median): 50% are taller, 50% are shorter. It’s the distribution anchor, not a performance KPI.
P3 / P97 (boundaries): Not pass/fail or max score. They’re statistical reference limits. We’ll break them down in Section 2.
Ops folks know this: would you flag P50 latency as “mediocre service”? No, because you know it’s just the baseline distribution.
So why panic over a P30 height? Anxiety won’t squeeze out an extra cm. It’ll just boost sales for those “growth supplement” scams.
I’ve seen too many of these blowups in parent groups: report says P35, parents spend the night researching “height-boosting” supplements, and get absolutely wrecked by private-domain WeChat resellers.
The percentile doesn’t carry a value judgment. You do.
In the WHO growth standards (and China’s derivative), P3 to P97 roughly maps to mean ±2 standard deviations.
~94% of the population falls in this band—out of 100 kids, ~94 are just born to sit here. That’s math, not mysticism.
Below P3: <3% of peers. Flags “needs monitoring,” not “diagnosed pathology.” Doctors won’t fixate on a single data point; they’ll track the curve and growth velocity.
Above P97 (height): Don’t panic. Usually a win, but rule out bone age and precocious puberty—growing fast and maturing fast are two different processes.
Above P97 (weight): Totally different beast. Points to overweight risk. Time to dial back the diet and ramp up movement.
Does <P3 automatically mean growth hormone injections? No. Check three things first: parental height (genetic baseline), growth velocity (cm/year), and curve morphology (consistently low or a sudden drop).
A kid consistently tracking P2 with short parents and normal annual velocity? Totally different triage path than a kid who dropped from P50 to P3 in six months.
The latter is a hard failure signal. The former is likely just “factory default.”
Don’t gamble on luck, and don’t gamble against it. If you’re unsure, book a pediatric wellness visit. It’s way less painful than self-diagnosing via search engines.
Ops know this: a single CPU spike proves nothing. You wouldn’t reboot the whole cluster on it.
A single dot on a checkup report is a point sample, and the noise floor on that sample is absurdly high.
Measurement noise: 1–2cm taller in the morning vs. evening (spinal discs compress during the day), half-a-pound weight swing pre/post meal, socks on/off, posture, scale calibration—all common failure modes.
Age discontinuity: Under 3, they measure recumbent “length.” Over 3, it’s standing “height.” The datasets don’t perfectly stitch; a ~1cm gap is normal, not an anomaly.
Growth curve: Plot height/weight from every checkup post-birth. That line should follow its own lane, running roughly parallel to the reference bands.
So what does a single P15 tell you? Nothing. He might’ve been P25 last month and just got measured short this time.
Watch for two actual patterns:
Steep drop: Plunging from P50 to P10 in a year, crossing two bands. Signals a velocity issue (nutrition, endocrine, chronic condition). Get it checked.
Plateau: <5cm height gain/year during school age, or a curve that flatlines long-term. Same reason to re-evaluate.
Velocity benchmarks: ~25cm in year 1, ~10cm in year 2, 5–7cm/year from age 2 to pre-puberty, 6–9cm/year during the pubertal growth spurt.
If you’re below the stage’s lower bound, stop gambling. Book a pediatric wellness or pediatric endocrinology appointment.
Before evaluating the kid, calculate the “expected trajectory” handed down by the parents. Otherwise, you’re trying to measure a P10 and a P75 with the same ruler.
Target Height (CMH rough estimate):
Example: Dad 172cm, Mom 160cm → son’s target height ≈ 172.5cm. Normal range: ~167.5–177.5cm.
Map that number back to the percentile curve, and you’ve got the kid’s “theoretical baseline lane.”
Deviation alert: Target height lands at P60, but the kid’s been flatlining at P5 for years. That’s a three-band drift. That’s a hospital visit, not a “late bloomer” excuse.
“We’re both short, maybe the kid will defy the odds?” Genetics accounts for ~70% of height variance. There’s no free lunch on genetic drift. Upset cases exist, but probability isn’t on your side.
The remaining ~30% (sleep, exercise, nutrition, chronic condition management) is your actionable surface area. And no, you can’t arbitrage that with a last-minute sprint.
Height isn’t a stock chart. Don’t expect to go all-in in the final year before puberty to make up the difference. The growth spurt window is 2–3 years. Once it closes, it’s closed.
Need to run to the hospital for every checkup? No. The workflow is three steps:
1. Log date, height, and weight at every checkup. Stick to one standard throughout (don’t flip between WHO and national standards like a broken router);
2. Plot the points on the curve. Track the trend, not the individual data points;
3. Only hit the hospital if you see a steep drop, plateau, or significant drift from the genetic lane. Otherwise, stop doomscrolling and scaring yourself.
If manually cross-referencing PDF tables is a pain, drop your kid’s data into our Height & Weight Percentile Calculator. It spits out the WHO percentile and band instantly. Log it once per visit, and you’ve got a personalized growth curve—way more reliable than staring at isolated numbers and guessing.
Q1: Kid’s been flatlining at P10. Is that developmental delay?
No. As long as the curve runs parallel to the reference bands and annual velocity is normal, P10 is just his baseline. Someone has to be on the left side of the distribution. That’s not a bug.
Q2: Is a higher percentile always better?
For height, sure, take the win. But crossing P97 warrants a bone age and precocious puberty check. For weight, higher is worse—it points toward overweight. Don’t conflate the two metrics.
Q3: WHO vs. Chinese standards are conflicting. Which one do I trust?
0–2 years: negligible difference. School age: slight variance, but it won’t break trend analysis. The critical part is using one standard consistently to plot the curve. Switching rulers daily just manufactures “anomalies” out of thin air.
相关推荐

tools, tutorial, why base conversion is the programmers rite of passage an introduction to binary...

tools, tutorial, why youre still tired after 8 hours of sleep how to use the 90minute sleep cycle...

tools, tutorial, what happens to your body on day x after quitting smoking a timeline from 72 hou...

tools, tutorial, how to accurately calculate your due date the truth behind the twoweek differenc...
tools, tutorial, six yearend bonus tax traps why a 1yuan raise could cost you 2,000...
评论列表 (0条)